First complete reception of a CUBESAT in UHF (UVSQ-SAT)
Today, May 07, 2021, we received and fully decoded a transmission from a CUBESAT from Saint Quentin en Yvelines University, whose emission characteristics are close to our future nano satellite OGMS-SA.
This is the UVSQ-SAT nanosatellite which was launched at the end of January 2021 and whose description can be found on the site:
http://uvsq-sat.projet.latmos.ipsl.fr/
- Tracking with antennas (GPREDICT software + ROTCTLD server)
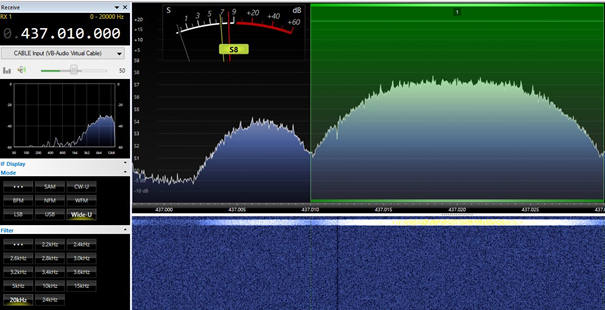
- SDR radio reception in UHF with Doppler frequency correction (SDR console software)
- Decoding of frames at 9600 bits / s and sending of frames via TCP / IP (SoundModem BPSK G3RUH 9600 software).
- Recording of frames for use (AGW online kiss software).
The passage of the nano satellite lasted 10 minutes with a maximum elevation of 55 ° above the eastern horizon.
We were able to decode and record 1347 frames. Here is a preview (3 frames).
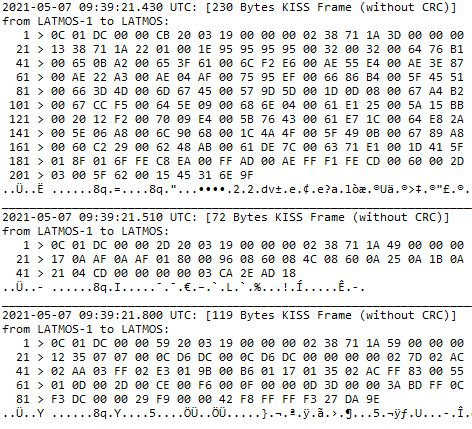
The code for CUBESAT is LATMOS-1.
Using telemetry decoding software that was developed by German, Mike Rupprecht (Callsign DK3WN, site https://www.dk3wn.info ), we can use some of this data.
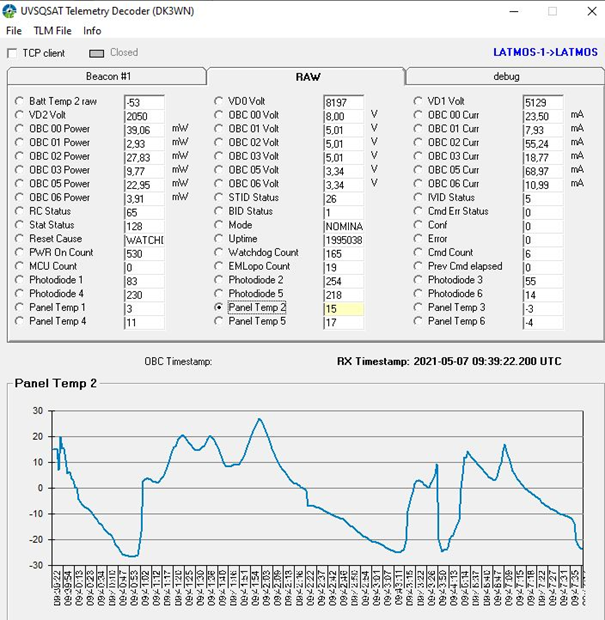
On this graph we can see the temperature variations on one of the six faces of the CUBESAT (Panel Temp 2) which alternates between positive and negative and which are linked to an alternating illumination of the nanosatellite by the sun.
To increase the decoding and recording possibilities, we were able to implement another telemetry decoding software from the CUBESAT UVSQsat developed by the AMSAT France association (UVSQsat Decoder) and which has the particularity of recording the frames in real time. on a remote website.
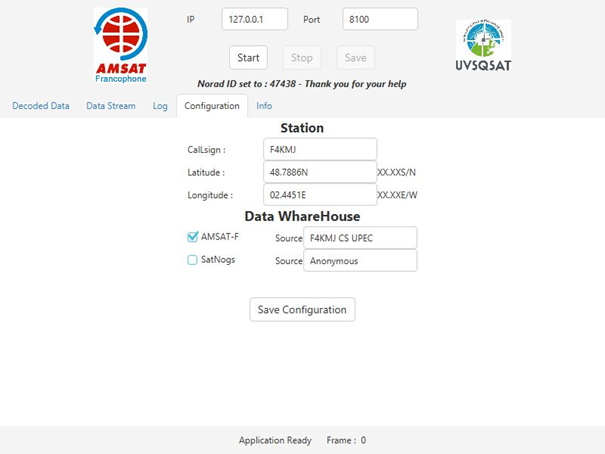
The frames are stored in a database accessible by the website:
This makes it possible to combine the receptions made by many satellite reception stations to have data accessible to all. Here is an example of a recorded frame from our ground station F4KMJ Space Campus UPEC:
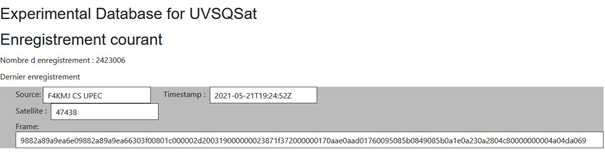
The recovered data can be displayed by a grafana online program:
https://amsat.electrolab.fr/grafana/d/ujwd-SaMz/uvsqsat?orgId=1
Here is an example of data (solar panel temperatures) and graph that can be viewed among others:
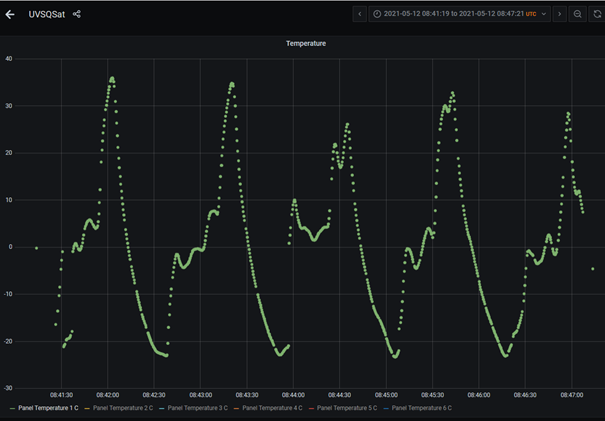
The timescale here is linear, we observe temperature variations on one side which are periodic.
We can therefore clearly see here the advantage of putting a solar panel on each of the six faces of the CUBESAT to have a source of solar energy that remains stable regardless of the orientation of the satellite.
Finally, to test the automatic operation of the ground station on reception, we launched a few acquisitions to recover frames during a night pass: a conclusive and successful test!
Our reception chain is now operational.
Article written by Daniel Kalinowski, head of the ground station and the CAMPUS SPATIAL UPEC radio club